Confidence interval
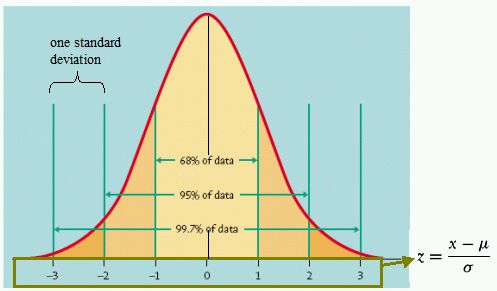
A 95 per cent confident for a population mean looks like.

In practice we seldom know that is known. Therefore most of the times an estimate of standard deviation in the sample (sometimes denoted as Failed to parse (unknown function "\Large"): {\displaystyle \Large\hat\sigma} ) is used:


If we use:

We can make a conclusion on determining the minimum sample size given a requested error level and confidence level::

Adding up confidence intervals for the difference of means is given by:

When the sample size comes closer to the population size, the error will become smaller. Using the finite population correction factor this can be taken into account:

So corrected with the finite population correction factor a 95 per cent confident for a population mean looks like:

The T-distribution can be used instead of the Normal distribution when defining confidence intervals when sample size is small or the standard deviation is unknown.
Part of M7-Quantitative Decision Methods-S3 - Normal Distribution and confidence intervals
