Difference between revisions of "Normal distribution"
(Replaced content with "Normal distribution Category:mbi Category:Decision Category:M7 Category:Methods Category:Quantitative Category:Term") Tag: Replaced |
|||
| Line 1: | Line 1: | ||
| − | Normal distribution | + | The normal distribution is the most widely used statistical distribution and is defined by its mean <math> \mu </math> and standard variance <math> \sigma </math> |
| + | |||
| + | <math>P(x)</math> = <math>\frac{1}</math>{{\sigma \sqrt {2\pi } }}e^{{{ - \left( {x - \mu } \right)^2 } \mathord{\left/ {\vphantom {{ - \left( {x - \mu } \right)^2 } {2\sigma ^2 }}} \right. } {2\sigma ^2 }}}<math></math> | ||
| + | |||
| + | The ''standard normal distribution'' is scaled back to a mean of 0 and a standard deviation of 1: | ||
| + | |||
| + | <math>Z= \frac {X-\mu}{\sigma}</math> | ||
| + | |||
| + | <html> | ||
| + | <img src="/static/files/MBI/Module%207/stdnormaldist.jpg" width=500 | ||
| + | </html> | ||
| + | |||
| + | Useful properties of the normal distribution are: | ||
| + | * The total area under the standard normal distribution curve is 1. | ||
| + | * At Z=0 the total area under the curve is 0.5 | ||
| + | * To measure the area between two Z-values you can subtract the z values (Look up in the [[Standard Normal Distribution Table|Standard Normal Distribution Table]]) To find the probability of a value between 1 and 1.1 standard deviations above the mean you calculate: | ||
| + | {{{ | ||
| + | Area above Z = 1 is 0.1587 | ||
| + | Area above Z = 1.1 is 0.1357 | ||
| + | }}} | ||
| + | Therefore the area between Z=1 and Z=1.1 is 0.3413 - 0.3413 = 0.0230 | ||
| + | * It is symmetric. The probability to be -Z away from the mean is equal to being away +Z. | ||
| + | |||
| + | The normal distribution can be used to approximate the binomial distribution, <math>np</math> is the mean and <math>\sqrt{np(1-p)}</math> is the standard deviation of a binomial distribution. Therefore Z can be written as: | ||
| + | Z = <math>\frac{X=np}{\sqrt {np(1-p)}}</math> | ||
| + | |||
| + | And the poison distribution: | ||
| + | Z = <math>\frac{X-\lambda}{\sqrt \lambda}</math> | ||
| + | |||
| + | Example of the latter. If the average # of broken eggs is 50. What is the probability there will be more than 70 broken eggs? | ||
| + | |||
| + | Mean = <math>\lambda</math> = 50 | ||
| + | Standard deviation= <math>\sqrt \lambda</math> = 7.07107 | ||
| + | |||
| + | The area requires is the area above X=70.5 so Z will be: | ||
| + | Z = <math>(70.5 - 50)/7.07107 = 2.8988</math> | ||
| + | This makes the probability 1 - 0.5 - 0.4980 = 0.002 | ||
| + | |||
| + | Part of: [[M7-Quantitative Decision Methods-S3 - Normal Distribution and confidence intervals|M7-Quantitative Decision Methods-S3 - Normal Distribution and confidence intervals]] | ||
[[Category:mbi]] | [[Category:mbi]] | ||
Latest revision as of 20:01, 27 August 2020
The normal distribution is the most widely used statistical distribution and is defined by its mean and standard variance


= Failed to parse (syntax error): {\displaystyle \frac{1}} {{\sigma \sqrt {2\pi } }}e^{{{ - \left( {x - \mu } \right)^2 } \mathord{\left/ {\vphantom {{ - \left( {x - \mu } \right)^2 } {2\sigma ^2 }}} \right. } {2\sigma ^2 }}}

The standard normal distribution is scaled back to a mean of 0 and a standard deviation of 1:

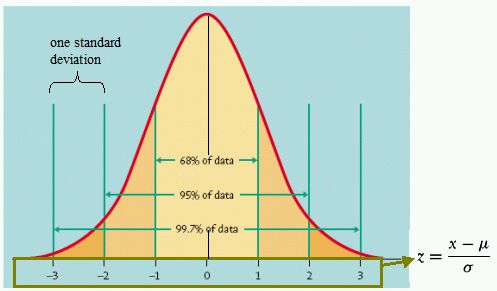
Useful properties of the normal distribution are:
- The total area under the standard normal distribution curve is 1.
- At Z=0 the total area under the curve is 0.5
- To measure the area between two Z-values you can subtract the z values (Look up in the Standard Normal Distribution Table) To find the probability of a value between 1 and 1.1 standard deviations above the mean you calculate:
{{{ Area above Z = 1 is 0.1587 Area above Z = 1.1 is 0.1357 }}} Therefore the area between Z=1 and Z=1.1 is 0.3413 - 0.3413 = 0.0230
- It is symmetric. The probability to be -Z away from the mean is equal to being away +Z.
The normal distribution can be used to approximate the binomial distribution, is the mean and is the standard deviation of a binomial distribution. Therefore Z can be written as: Z =


And the poison distribution: Z =

Example of the latter. If the average # of broken eggs is 50. What is the probability there will be more than 70 broken eggs?
Mean = = 50 Standard deviation= = 7.07107


The area requires is the area above X=70.5 so Z will be: Z = This makes the probability 1 - 0.5 - 0.4980 = 0.002

Part of: M7-Quantitative Decision Methods-S3 - Normal Distribution and confidence intervals
