Difference between revisions of "Fourier image"
(Created page with "<html>A fourier image can be interpreted as follows. Imagine the image as an axes plane. Each pixel in the image has a greyscale<br /><ul><li>Each (x,y) position denotes a fre...") |
|||
| Line 44: | Line 44: | ||
two-thirds of the average grayscale -value.<br /><br | two-thirds of the average grayscale -value.<br /><br | ||
/><img | /><img | ||
| − | src="file:/ | + | src="file:///C:/DOCUME~1/dsn/LOCALS~1/Temp/moz-screenshot.jpg" |
/><br /><br /></html> | /><br /><br /></html> | ||
[[Category:microscopy]] | [[Category:microscopy]] | ||
Latest revision as of 20:14, 27 August 2020
A
fourier image can be interpreted as follows. Imagine the image as an
axes plane. Each pixel in the image has a greyscale
- Each (x,y) position denotes a frequency that
is present in the image.
- The grayscale level at a position (x,y) indicates the change in contrast level present in the image for that frequency.
For
example, suppose that there is the value 20 at the point that
represents the frequency 0.1 (or 1 period every 10 pixels). This means
that in the corresponding spatial domain image I the intensity values
vary from dark to light and back to dark over a distance of 10 pixels,
and that the contrast between the lightest and darkest is 40 gray
levels (2 times 20). Black indicates 'no variation'. White indicates
'maximum variation'.
The example image on the left shows 2
pixel wide vertical stripes. On the right you can see the fourier
image.
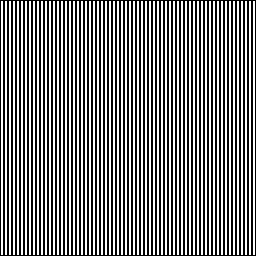
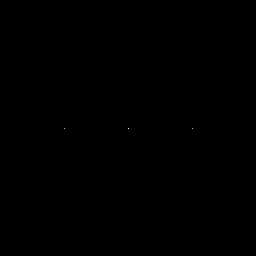
If we look
carefully, we can see that it contains 3 main values: the DC-value and,
since the Fourier image is symmetrical to its center, two points
corresponding to the frequency of the stripes in the original image.
Note that the two points lie on a horizontal line through the image
center, because the image intensity in the spatial domain changes the
most if we go along it horizontally. The distance of the points to the
center can be explained as follows: the maximum frequency which can be
represented in the spatial domain are one pixel wide stripes:
`f_max=1/1text{pixelsize}`
`f =
1/2text{pixelsize}=f_max/2`
Further investigation of the Fourier image shows that the
magnitude of other frequencies in the image is less than of the average grayscale value,
i.e. they don't make any significant contribution
to the image. The magnitudes of the two minor points are each
two-thirds of the average grayscale -value.

