Difference between revisions of "Whale curve"
(Created page with "After estimating the profitability of each customer, it is informative to rank them from most to least profitable and plot the accumulated profit in a graph — the x-axis has...") |
|
| (One intermediate revision by the same user not shown) | |
(No difference)
| |
Latest revision as of 19:26, 27 August 2020
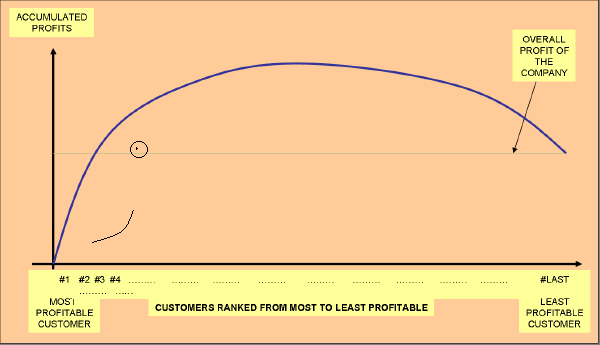
After estimating the profitability of each customer, it is informative to rank them from most to least profitable and plot the accumulated profit in a graph — the x-axis has the ordered list of customers; the y-axis has the accumulated profit. Therefore, the accumulated profit for the most profitable customer is its profit, for the two most profitable customers is the addition of their profits, and so on. This graph gives a good picture of how profitability happens in a company.
This graph frequently proves that companies have very heterogeneous client portfolios. Often, the distribution of revenues and profits fits the 80/20 rule, whereby the company makes 80% of its revenues or profit from 20% of its customers. Typically it also reveals that a profitable company is making money with one group of customers and losing money with another large group of customers. Even stronger stated is the 20-225% rule.
The shape of the graph resulting from this type of analysis often resembles the top of a whale coming out of the water so the pattern is called the whale curve.